 Download slides
Weather disruptions raise spot rates across equipment types

Onthispage
Winter storms have disrupted the typical seasonal rate softening across several affected regions, preventing prices from following their normal downward trajectory. As a result, both contractual route guide performance and spot rates posted stronger year-over-year (y/y) comparisons in January and February.
U.S. spot market
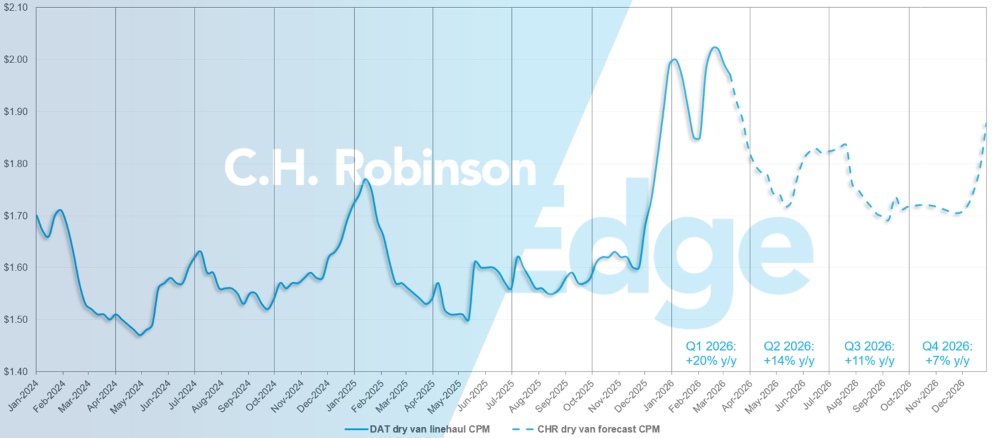
The C.H. Robinson 2026 long-haul dry van cost-per-mile forecast is being raised from 10% y/y growth to 12% y/y.
Roughly half of the increase or 1%, is from rates coming in moderately higher from winter storm activity. Higher rates entering March, combined with continued tightening of capacity, make it increasingly unlikely that rates will bottom out at $1.65 as previously forecast. For this reason, the trough estimate is being raised to $1.72. The second half of the 2026 forecast remains unchanged.
In terms of freight-cycle dynamics, the market is still stuck in an environment where truck operating costs continue to increase idiosyncratically, several years into a freight downcycle. One factor is that restrictions on commercial driver’s licences continue to tighten carrier/driver supply, translating into upward pressure on driver wages.
Not much has changed in terms of the freight demand environment near term. However, elevated oil prices will be closely monitored. If oil prices translate into meaningfully higher gasoline prices, that can weigh on consumer spending.
U.S. spot market forecast: Dry van truckload
The C.H. Robinson 2026 dry van cost-per-mile forecast is being increased to +12% year over year, up from +10% y/y.
C.H. Robinson spot market dry van truckload forecast
U.S. spot market forecast: Refrigerated truckload
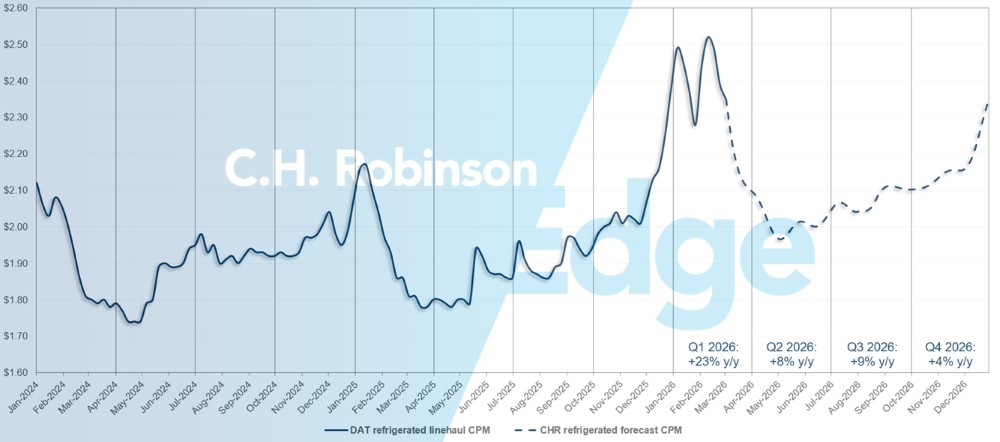
The C.H. Robinson 2026 refrigerated van cost-per-mile forecast is being increased to +11% year over year, up from +8% y/y.
C.H. Robinson spot market refrigerated truckload forecast
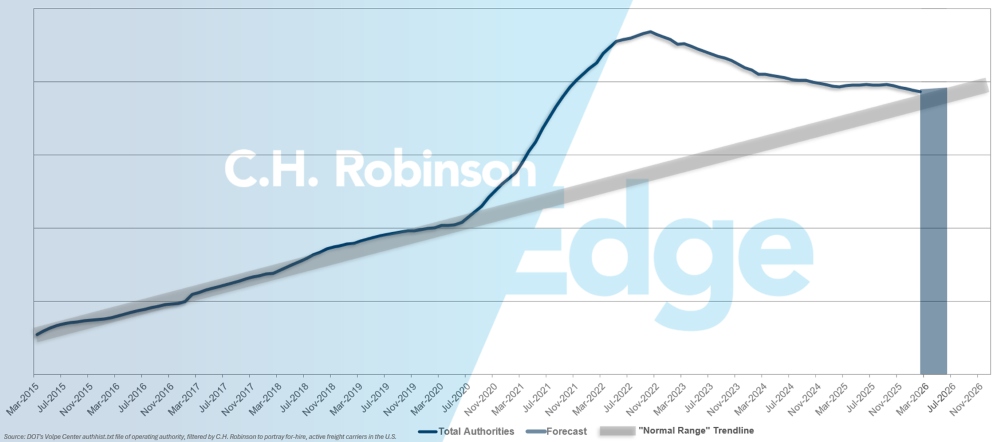
For-hire carrier authorities forecast
If the current pace of U.S. carrier attrition continues, carrier authority counts would return to historical levels by mid-year.
For-hire carrier forecast
Contract truckload environment
The following insights are derived from C.H. Robinson Managed Solutions™, which serves a large portfolio of customers across diverse industries.
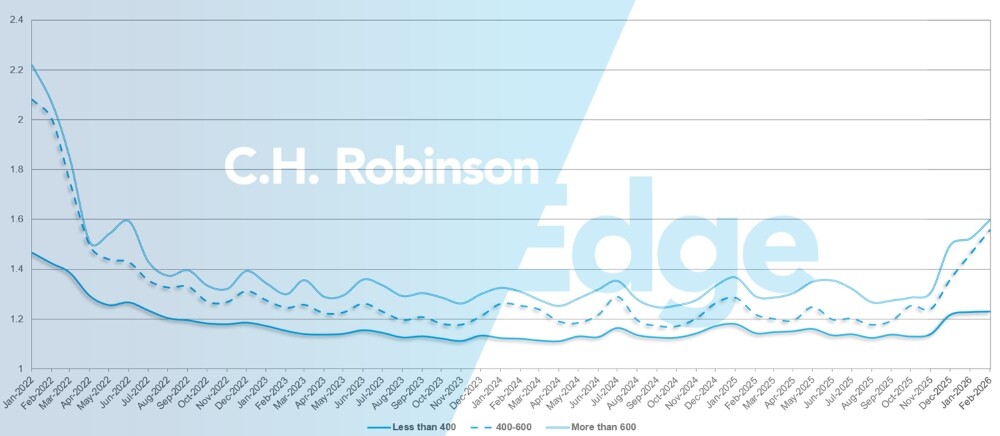
Route guide depth is an indicator of how far a shipper needs to go into their backup strategies when awarded transportation providers reject a tender. A route guide depth of 1 would be perfect performance and 2 would be extremely poor.
As displayed in the following chart, this measurement had remained flat at a historically low level for approximately two years. For the month of February, route guide depth across all North America deliveries was 1.39, up compared to the previous month.
From a mileage perspective, long hauls of more than 600 miles had a route guide depth of 1.53 in February, which is worse compared to the prior month of January 2026 at 1.50 and worse compared to February 2025, which was at 1.37. For shorter hauls of less than 400 miles the route guide depth for February 2026 was 1.23, which is slightly worse than the previous month of 1.22 and slightly worse than February 2025 at 1.18.
North America route guide depth metrics: By length of haul
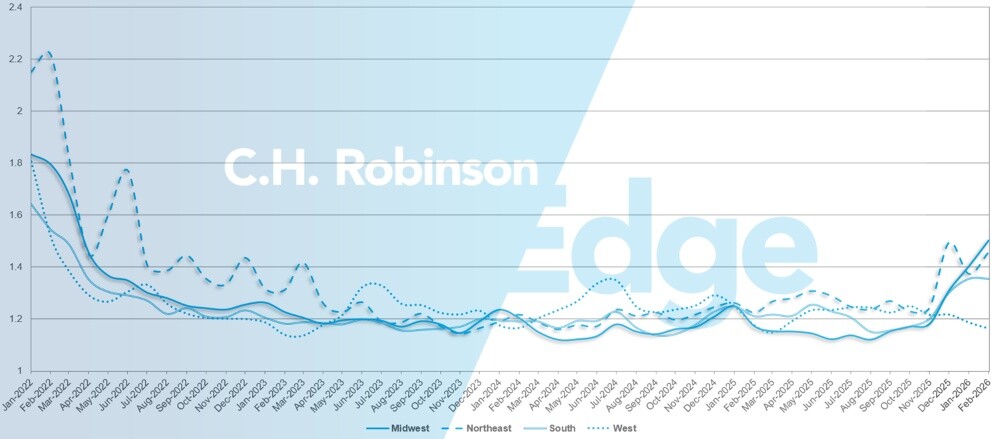
Geographically, the West experienced the largest decrease in route guide depth of all regions, improving by 2% from the previous month, while the Midwest and Northeast experienced the largest increases, worsening by 7.2% and 6.2% respectively. These diverging trends highlight the impact of winter weather on contractual service.
Route guide depth now varies across the United States, with regional readings as low as 1.16—which is considered very soft—and up to 1.5, which is only moderate. For context, a value of 2.0 or higher would have indicated a much tighter market, as seen in 2022.
U.S. route guide depth metrics: By region
Refrigerated Truckload
East Coast United States
The Northeast has seen a meaningful return to more typical market conditions over the past couple of weeks. Freight is increasingly being pre-booked and day-of deliveries are steadily declining, signalling improved stability. Barring any additional major winter weather events, expect this normalisation trend to continue through the remainder of the season.
In the Southeast, conditions have returned to normal seasonality following the recent floral surge, with a softer market expected until produce volumes begin to ramp up. However, cold weather in Florida and Georgia reportedly damaged a portion of the crops, requiring replanting. As a result, the start of produce season is now expected to be delayed by approximately one month, with activity likely beginning in mid-to-late April rather than the typical mid-to-late March timeframe.
Central United States
The Midwest saw a general loosening of capacity through much of February as post-holiday backlogues cleared and networks rebalanced. However, repeated winter storm activity introduced enough volatility to prevent rates from declining in a consistent or widespread manner. While trucks were increasingly available between weather events, short-term disruptions and lingering delays kept pricing from fully softening across the region.
In contrast, parts of the mid-South experienced a more traditional easing cycle, with both capacity and rates trending downward as seasonal demand moderated and weather impacts were less severe. Outbound Texas is beginning to show more divergence depending on market and lane. Some areas are seeing improved availability, while others are starting to tighten as cross-border and seasonal volumes build.
As produce season begins to ramp up, particularly with commodities such as avocados moving northbound from Mexico, expect pressure at key border crossings to increase. This seasonal shift typically creates tighter capacity pockets and day-to-day rate volatility in south Texas markets. Proactive planning, extended lead times and flexible pickup scheduling will be critical to minimising disruption and managing cost exposure as these cross-border flows accelerate.
West Coast United States
In February, West Coast conditions largely aligned with typical seasonal patterns. Capacity returned across most California markets, driving costs down from elevated January levels. Early in February, winter storms in the Midwest and East temporarily disrupted network flows and equipment was slow to cycle back into California. However, conditions largely normalised during the last two weeks of February.
Even historically tighter markets such as Arizona and the Pacific Northwest have begun to soften. As the end of first quarter approaches, California capacity is expected to continue building, supporting further cost declines across both intra-California and outbound long-haul lanes.
Arizona and the Pacific Northwest should also ease, though likely at a more gradual pace. Maintaining appropriate lead times will remain important, particularly with lingering winter risks. Notably, an avalanche near Reno, Nevada, created temporary disruptions during the third week of February. Looking ahead, growing regions are expected to begin ramping up in late March and early April as seasonal produce activity approaches.
Flatbed truckload
Recent data point to a tightening flatbed market, with building products showing modest growth and industrial and metal freight continuing to gain momentum. Combined with winter storm disruptions, these shifts have pushed conditions to their tightest level in several years, with load-to-truck ratios exceeding 60-to-1 in late February, the highest since mid-2022.
This strength is amplified by over three years of capacity contraction, where fewer trucks mean even modest demand gains have an outsized impact. As more freight moves to the spot market, flatbed spot rates are up more than 12% y/y.
While some weather-related pressure should ease, a structurally smaller carrier base suggests elevated load-to-truck ratios may persist in select regions through peak construction months. Longer term, muted and uneven growth is expected, as tariff and trade uncertainty continue to weigh on largescale investment despite typical seasonal demand patterns.
This is a critical time to maximise use of your route guide and avoid exposure to spot-market price premiums. Flexibility on timing and equipment can improve tender acceptance and expand capacity options. Anticipate higher costs on short lead-time freight and specialised equipment. Co-ordinate closely with your C.H. Robinson representative as conditions remain fluid and responsive to weather and demand shifts.
Voice of the Carrier
Observations from a cross-section of the contract carriers in the C.H. Robinson network:
Market
- Carriers are narrowing their networks and enforcing rate discipline.
- Committed freight and structured capacity bids are increasing.
- With capacity tightening since December, one-way availability is limited.
Drivers
- Hiring is tied directly to secured freight.
- Select fleets are parking trucks due to unseated equipment.
- Targeted incentives support retention and regional balance.
Equipment
- Fleet replacement cycles are normalising.
- Tractor pricing and insurance costs remain elevated.
- Technology investments are improving freight selection and carrier margins.
 Actionable freight insights