 Download slides
Truckload rate outlook shifts higher for 2026
Published: Thursday, November 06, 2025 | 08:00 AM CDT
Onthispage
U.S. spot market
The C.H. Robinson spot rate forecast is shaped by broad market factors. To date, there’s little evidence of a catalyst on the horizon that would suggest freight volumes will increase materially next year. We did see a modest increase in industrywide freight volume as Q3 2025 progressed, which we tend to believe was more of a bump driven by consumer buying ahead of retailer price-hikes. The related increase in truckload rates pushed our 2025 forecast upward.
However, we don’t rule out further volatility from these dynamics. With cost and regulatory pressures on carriers, we believe rate increases will be sustained and have increased our 2026 forecast as well. We’ve noted before that truck operating costs continue to run high relative to where we are in the freight cycle. What’s new is the heightened enforcement of truck driver eligibility. This is expected to impact truck driver supply as 2026 progresses.
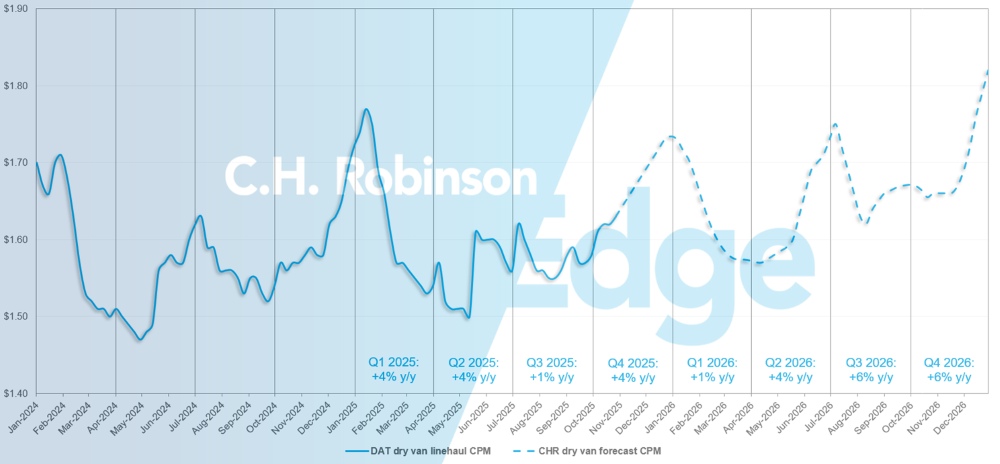
U.S. spot market forecast: Dry van truckload
The C.H. Robinson 2025 dry van cost per mile forecast has increased from +2% to +4% y/y, and the 2026 forecast has increased from +2% to +4% y/y.
C.H. Robinson spot market dry van truckload forecast
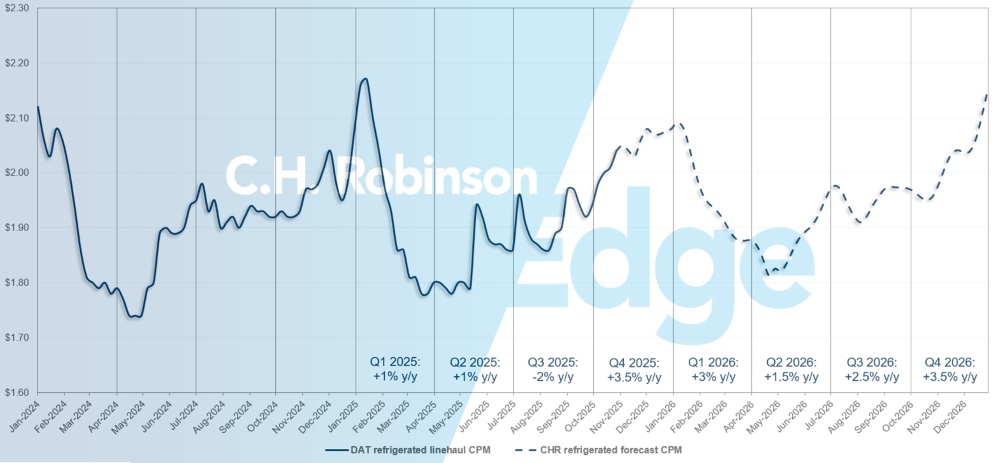
U.S. spot market forecast: Refrigerated truckload
The C.H. Robinson 2025 refrigerated van cost-per-mile forecast has increased from -1% to +1.5 y/y, while the 2026 forecast has increased from +2% to +3% y/y.
C.H. Robinson spot market refrigerated truckload forecast
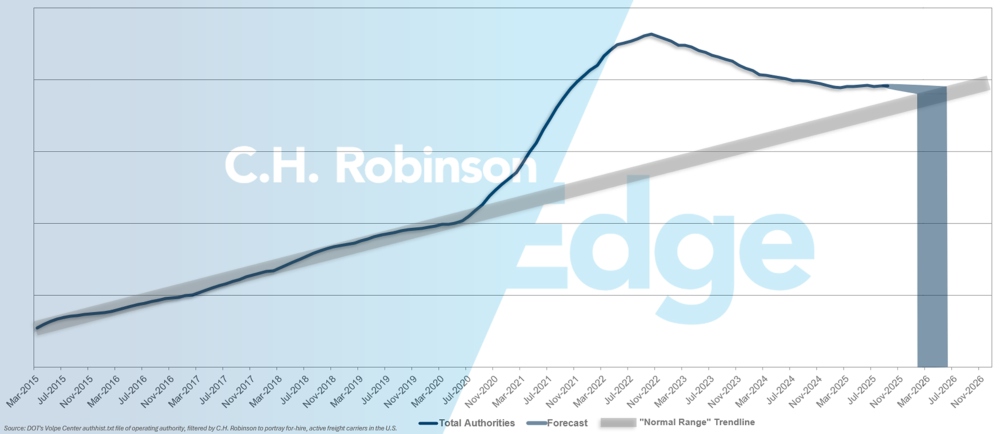
For-hire carrier authorities forecast
New rules for issuing and renewing non-domiciled Commercial Driver's Licenses (CDLs) have been making national headlines since they went into effect in September. As we predicted in the October Edge Report, the impact on truckload supply has not been immediately felt. Over time, the restrictions are expected to have a compounding impact along with other regulatory and enforcement changes for drivers such as English Language Proficiency.
While these regulations are resulting in additional drivers and carriers leaving the market, truckload supply is an ever-revolving door, with drivers and carriers entering and exiting the market for various reasons. The recent pace of carrier attrition hasn’t changed much. That means the market remains in a state of oversupply, although nearer to equilibrium. If the current pace of U.S. carrier attrition continues, carrier authority counts would return to historical levels in early 2026, possibly later.
For-hire carrier forecast
Contract truckload environment
The following insights are derived from C.H. Robinson Managed Solutions™, which serves a large portfolio of customers across diverse industries.
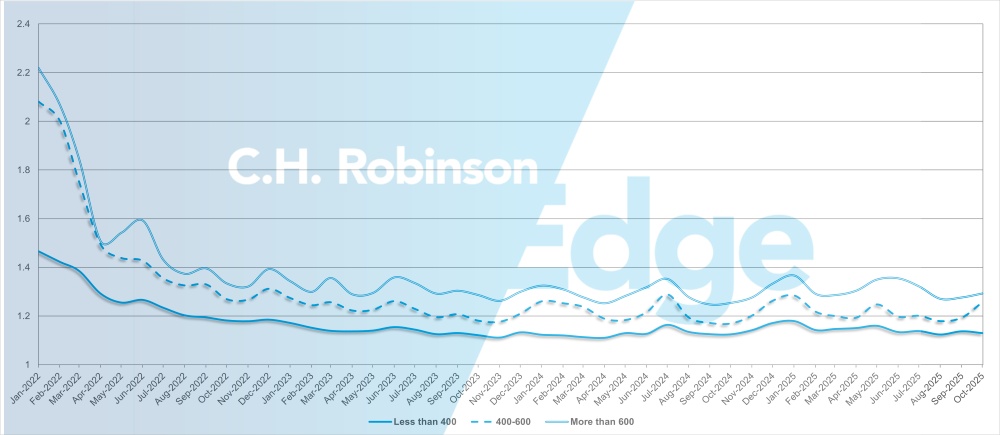
Route guide depth is an indicator of how far a shipper needs to go into their backup strategies when awarded transportation providers reject a tender. 1 would be perfect performance and 2 would be extremely poor. As displayed in the following chart, route guide depth has remained flat at a historically low level for approximately two years.
For the month of October, route guide depth across North America shipments was 1.20, slightly worsening compared to the previous month of 1.19.
From a mileage perspective, long hauls of more than 600 miles had a route guide depth of 1.29 in October, which is slightly worse compared to the prior month of September 2025, at 1.28, and worse compared to October 2024, which was at 1.25. The trend for shorter hauls of less than 400 miles is similar. Route guide depth for October 2025 on these shorter hauls was 1.13, which is slightly better than the previous month of 1.14 and slightly worse than October 2024 at 1.12.
North America route guide depth metrics: By length of haul
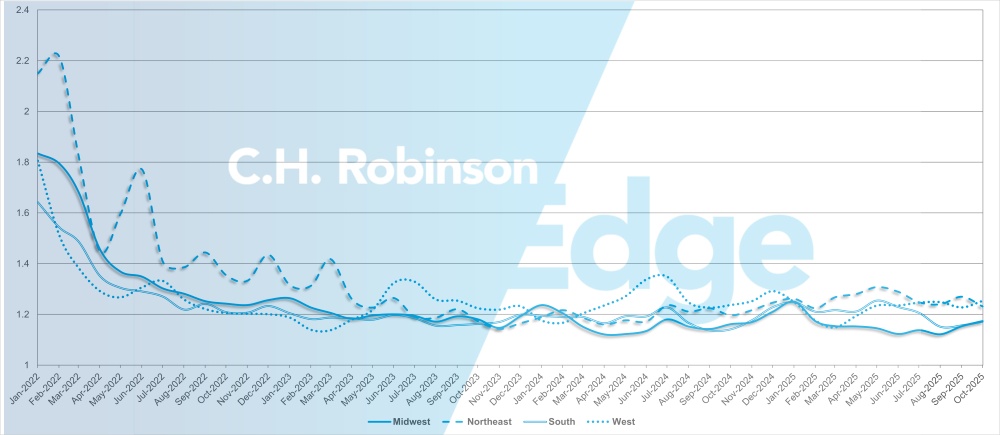
Geographically, the South experienced the smallest change of all regions, worsening by 1.5% from the previous month, while the Northeast experienced the largest change at 3.1%. Route guide depth still remains at low levels between 1.17 and 1.25 for all regions.
U.S. route guide depth metrics: By region
Refrigerated truckload
East Coast United States
The refrigerated market out of the Southeast remains relatively soft, with normal seasonal fluctuations and truck capacity generally available, even for same-day shipments. Produce volumes are gradually increasing out of Florida and southern Georgia, which is typical for this time of year, though still well below the levels seen in spring. Some additional activity is expected in this region through November, but not likely to cause major market disruption.
Out of the Northeast, conditions are tighter than usual for this time of year, particularly for long-haul shipments and freight heading to the West Coast. Spot opportunities have remained elevated, and load-to-truck ratios remain higher than normal. Through the first half of November, strong activity is expected to persist with seasonal produce moving through New Jersey ports and other holiday-related freight entering the market before volumes cool down in the back half of the month and to finish the year.
Central United States
The Upper Midwest continues to experience a slightly elevated market with some pockets of tightness, particularly on lanes heading to the Southeast due to lack of options coming back out of there. Rates are expected to remain at elevated levels to finish the year. Central states such as Arkansas, Kansas, and Missouri still have capacity available, though same-day freight is tightening, leading to higher costs for urgent shipments.
Outbound Texas remains relatively loose, with capacity readily available at competitive rates. Expect conditions to tighten as the holidays approach, especially in South Texas and at border crossings.
West Coast United States
The West Coast market followed historical norms through October as peak produce season wound down and harvests began to change heading into November:
- Strawberries are transitioning from California to Texas.
- Mixed vegetables are moving from Salinas, California, to Yuma, Arizona.
- Outbound Nogales, Arizona is ramping up with melons, which may temporarily tighten truck availability before rates stabilize as capacity adjusts.
- Outbound Washington and Idaho are seeing increased movement of apples and potatoes respectively, a trend expected to continue through the holiday season.
The Pacific Northwest will likely experience capacity tightness and elevated rates through mid-January. In California, expect the typical tightening of capacity during the weeks leading into and out of Thanksgiving, Christmas, and New Year’s Day.
Additionally, California is among the states facing tighter rules on issuing or renewing CDLs for non-domiciled drivers. This issue will need to be closely monitored for potential impacts on operations and capacity, but for now capacity remains broadly unimpacted.
Flatbed truckload
Over the past six to eight weeks, flatbed market trends have largely aligned with the five-year average. Rates and capacity tightened slightly through late September before softening in October, which is a typical seasonal pattern as construction activity slows. With limited external pressures, both cost per mile and capacity are expected to remain stable, with mild easing into mid-December before the usual year-end increase.
Continued carrier attrition underscores the imbalance of supply and demand. In late September, Montgomery Transportation, a large Alabama-based carrier operating roughly 450 trucks, ceased operations. The closure caused short-term volatility in the Southeast as displaced drivers transitioned to new fleets. Although most are expected to re-enter the market, localized capacity imbalances may persist in November.
Hurricane season remains a watchpoint, as recent Caribbean storms are a reminder of the potential for weather-related disruptions even outside the traditional peak hurricane window.
Tightened requirements for non-domiciled CDLs may result in minor and spotty impacts to flatbed capacity, but widespread disruption is not expected.
Flatbed loadings are up slightly y/y, though growth remains broadly distributed across sectors. Regional activity has been strongest but most volatile across the Southeast and West Coast. Unlike the dry van market, which often sees Q4 spikes tied to retail and holiday demand, flatbed activity tends to remain steadier through year end, with fewer seasonal disruptions and a more predictable demand curve.
Now is an ideal time for shippers to test markets and maintain close communication with their C.H. Robinson representatives regarding potential regional shifts. Some volatility is likely when moving freight into and out of northern states as weather becomes a greater factor and certain carriers adjust their routing preferences. Flexibility in shipment timing, equipment type, and rates remains the most effective way to manage seasonal variation.
Shippers should also continue monitoring less predictable influences such as late-season storms, wildfires, and interest rate fluctuations to stay ahead of potential disruptions and maintain service consistency through the remainder of the year.
Voice of the carrier
Observations from a cross-section of the contract carriers in the C.H. Robinson network:
Market
- Market conditions remain steady with only modest fluctuations expected; most carriers don’t see any signs of a sharp or sustained rebound. Contractual bid activity is beginning to increase, which is seasonally expected.
- Tariffs leading to decreased volumes and rising operating costs (insurance, equipment, and labor) continue to pressure margins, keeping service performance central to bid negotiations.
Drivers
- Driver turnover remains historically low as fleets tighten onboarding standards and focus on retention. Long-haul carriers, however, face labor competition from other industries looking to hire from the same pool of workers, like the oil and gas sector in certain regions.
- Many drivers are prioritizing improved work-life balance, influencing network planning and route preferences.
Equipment
- Most larger carriers are maintaining regular trade cycles and investing in fleet modernization to ensure reliability and efficiency.
- Some carriers are starting to cautiously plan for a $20,000 or more cost increase for a new truck if new U.S. emissions standards go into effect beginning with 2027 models and if tariffs on non-U.S.-made trucks and parts continue.
 Actionable freight insights